RSS.com provides industry-leading analytics to podcasters. Our analytics services follow state-of-the-art guidelines in the industry to measure podcast metrics.
Our analytics service is based on the data we collect each time we receive a download request for your show. Because we are the hosting platform, when a listener downloads one of your episodes via Spotify, Apple Podcasts, YouTube Music, Amazon Music etc... they leave a footprint in our system through a, so called, “log”.
From this listener data we build your Analytics page. It has two tabs, on every plan:
- Overview - a comprehensive snapshot of your entire show.
- Episodes (this page) - detailed data at the episode level.

2. Episodes tab
Delving into the specifics of each episode can provide actionable insights to improve your content. The Episode details tab in RSS.com Analytics offers an in-depth look at individual episode metrics, including downloads, listener engagement, and more.
Most Downloaded Episode and Episode Age at Download
The tab opens with two charts on the last 30 days of downloads, on every plan.
- Most Downloaded Episode shows the episode with the most downloads and how many it had. View details opens that episode’s page.
- Episode Age at Download groups those downloads by how old the episode was on the day it was downloaded: 0-7 days, 8-30 days, 31-90 days and 90+ days. Each bar shows its share of the downloads, and hovering over a bar shows the count. How to read it.
The episodes table
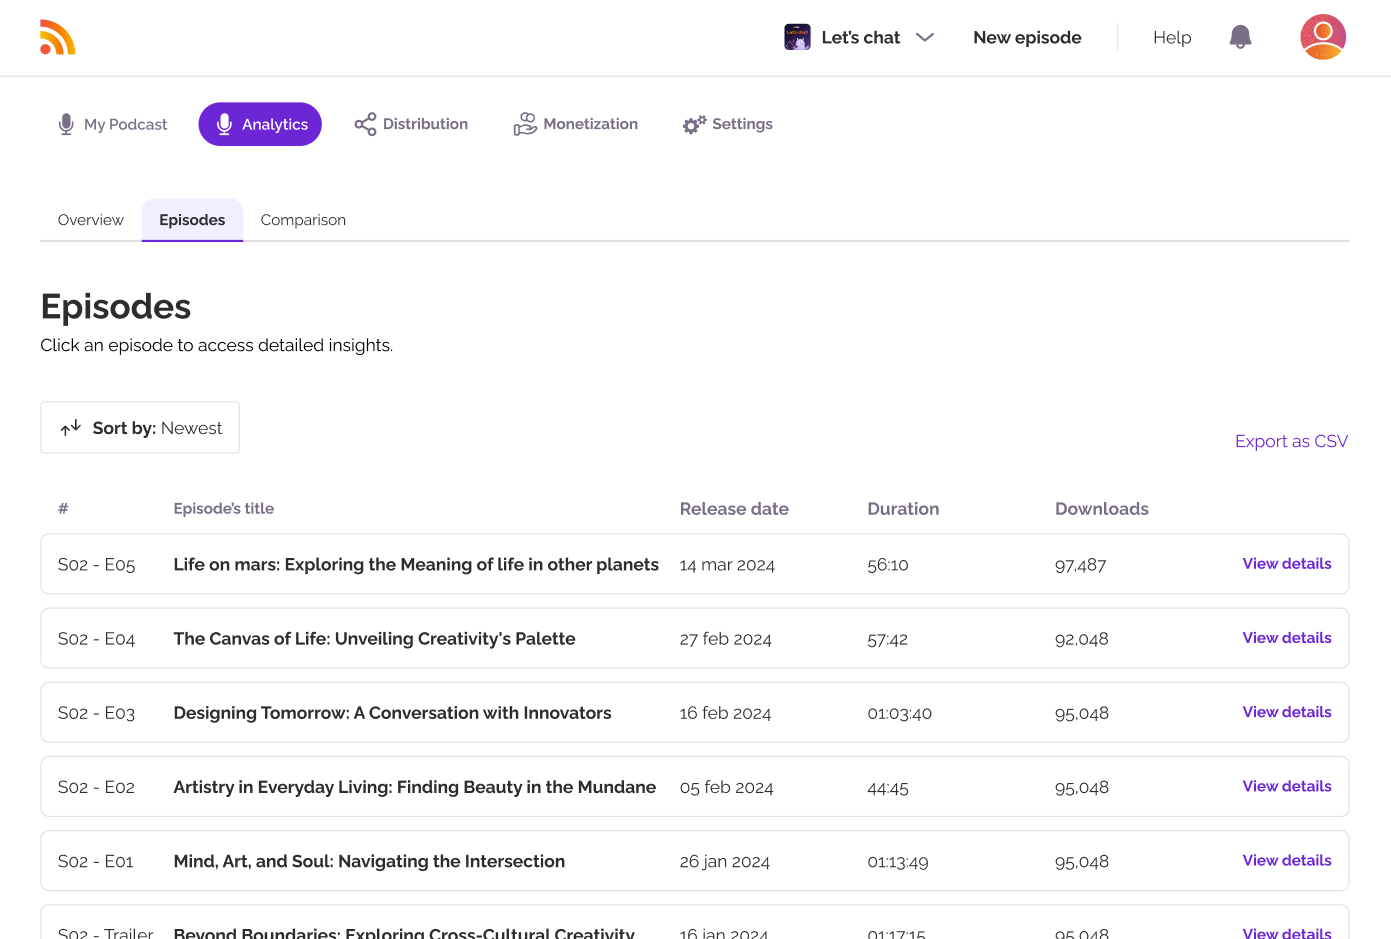
Every episode is listed with its number, title, release date, duration and total downloads. Sort by Newest or Most Downloaded, export the table with Export as CSV, or click View details on a row to open that episode. When you sort by most downloaded, episodes with no downloads yet are left out of the list.
To compare two episodes, tick the box next to each one and click Compare at the bottom of the page. See Comparison.
2.1. The episode detail page
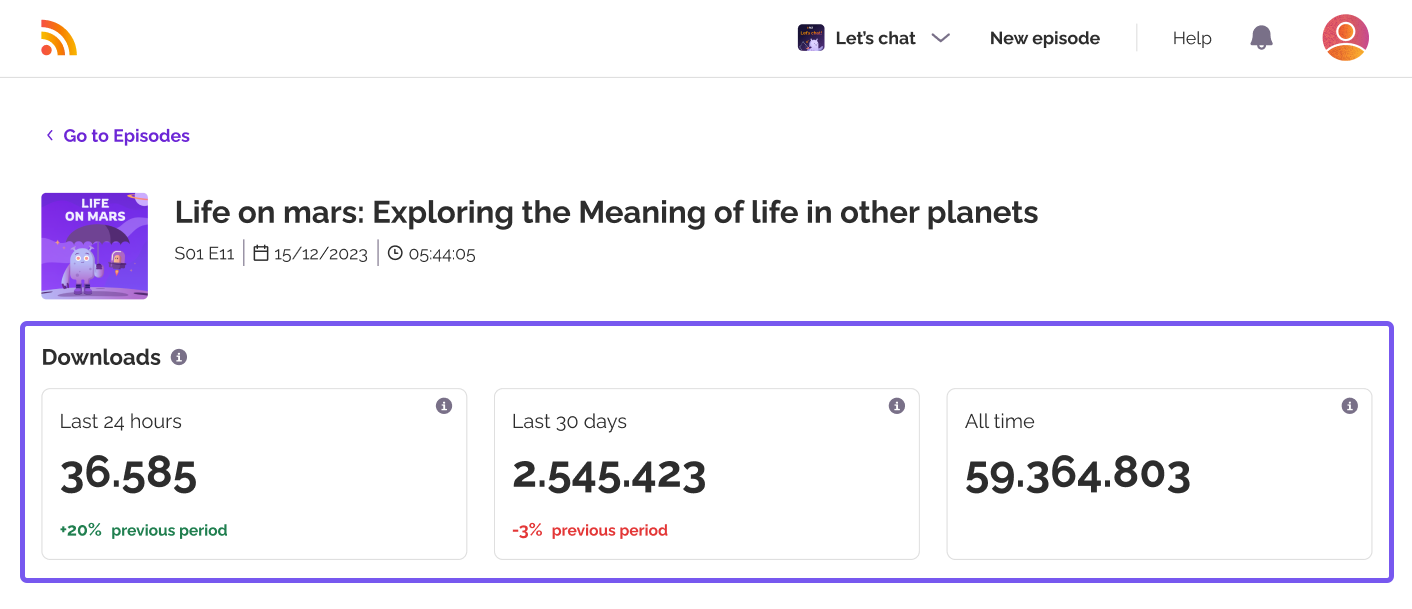
Click View details on any row to open that episode. The page opens on the episode itself: cover art, title, season and episode number, publish date and duration. Go to Episodes at the top takes you back to the list.
Everything below on that page is about the one episode you opened. The date range you pick applies to all of it, and each chart prints its total for that range beside the title.
2.2. Downloads: "Last 24 hours", "Last 30 days" and "All time"
In our metrics the term "download" represents any time a unique user accesses your content. It doesn't matter if a listener saves an episode on their device or streams an episode from an app. Each would count as a "download". Downloads are a rolling metric updated several times throughout the day.
Next to these, the Episode Age card shows how many days ago the episode was published.
2.3. Downloads over time
Use this graph to track your progress and identify trends with your Downloads. Keep in mind that total downloads (shown next to the title label) is also updated when the dropdown menu picker changes.
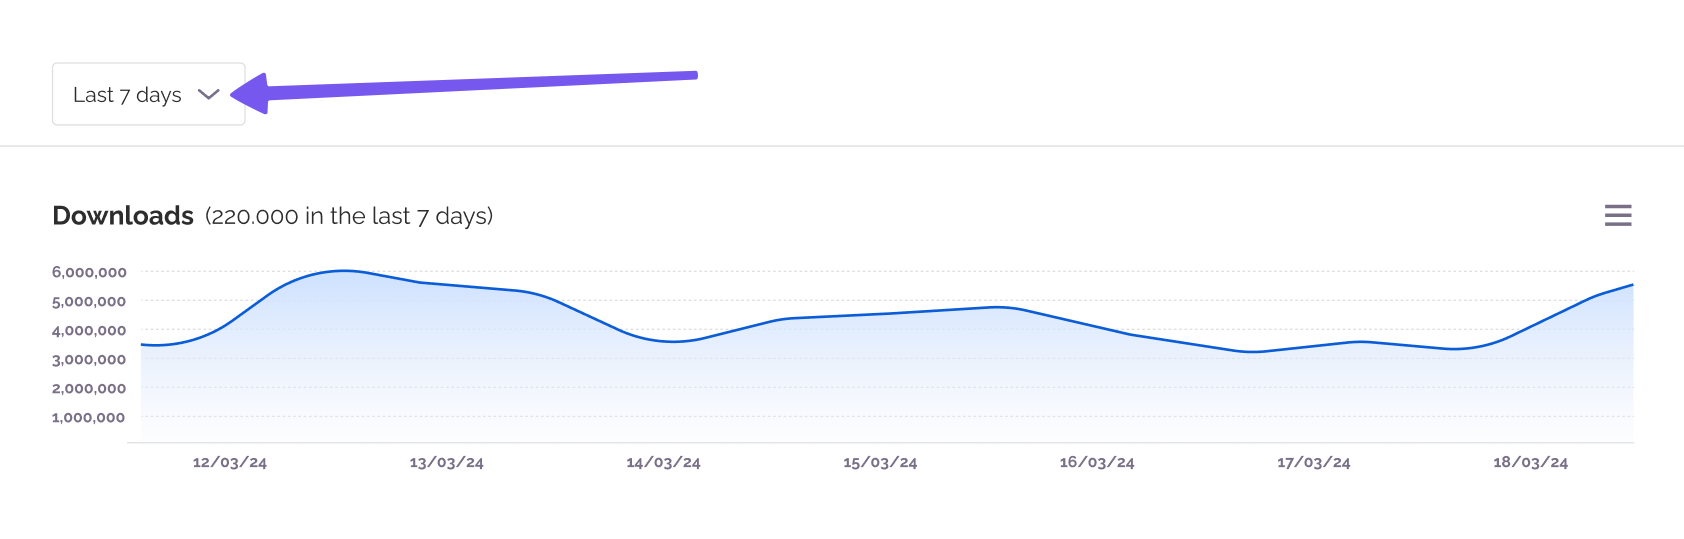
Important: Same as in the Overview tab, the date range for all the data displayed below, not just "Downloads timeline", but all the metrics down the fold, can be adjusted using the dropdown menu to the last 7, 14, 30, 90, or 180 days. Note that in the episode menu there's new options for 7, 14, and 30 days after release.
2.4. Listeners
A listener is an individual who listened to one or more episodes of your podcast. Here the count is for this episode only, over the range you picked above.
Each point counts a listener once, so daily figures do not add up to the total for a longer range. The count is an estimate built from the app and the network a request came from, not from a sign-in.
2.5. Top 5 cities and downloads by country
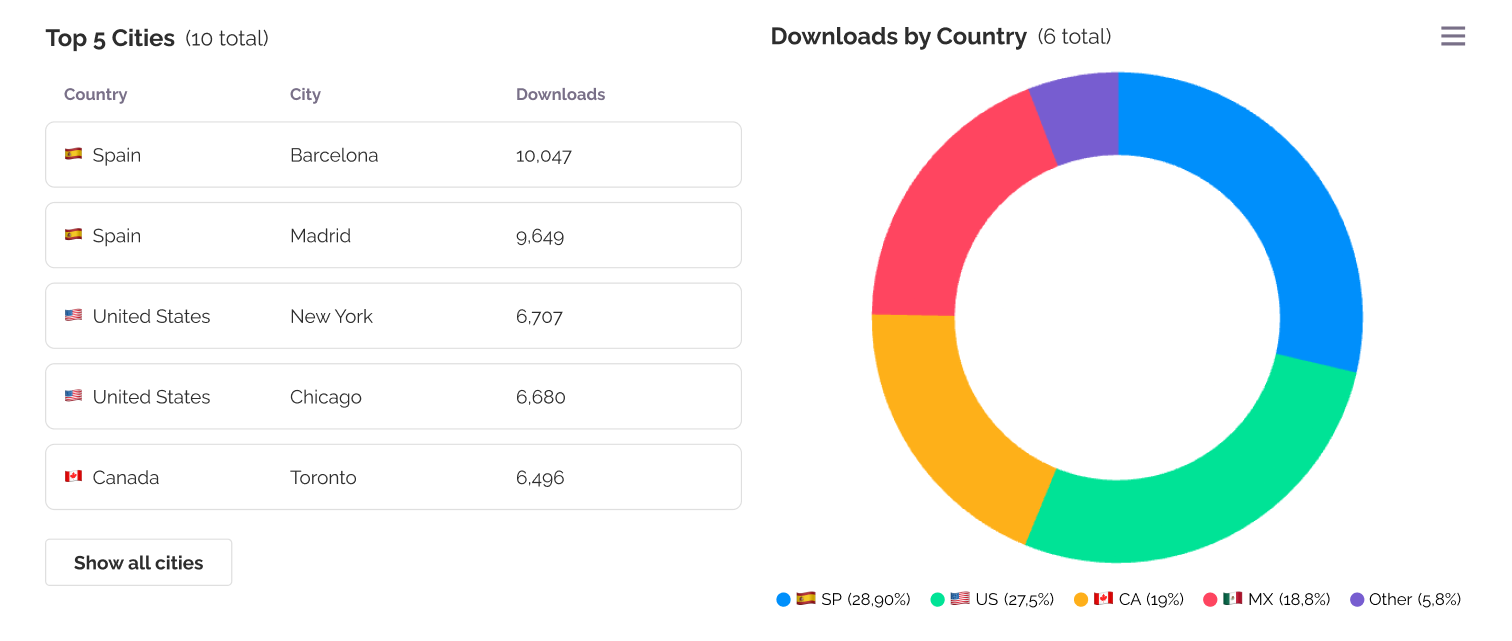
When analyzing your podcast’s performance, understanding where your audience is located can provide valuable insights. In RSS.com Analytics, you’ll find both city-level and country-level data to help you get a clearer picture of your listener distribution.
At the left, these are the top 5 locations - at the city level - with the highest number of downloads. Click "Show all locations" to see the full list of locations sorted by number of downloads. At the right, there’s the distribution of downloads by country.
2.6. Downloads by location
An interactive world map of locations with the highest downloads. Knowing where your listeners are tuning in from can greatly enhance your content strategy. With the Downloads by Location feature in RSS.com Analytics, you can see a detailed geographic breakdown of your audience, helping you tailor your episodes to better engage listeners from specific regions.
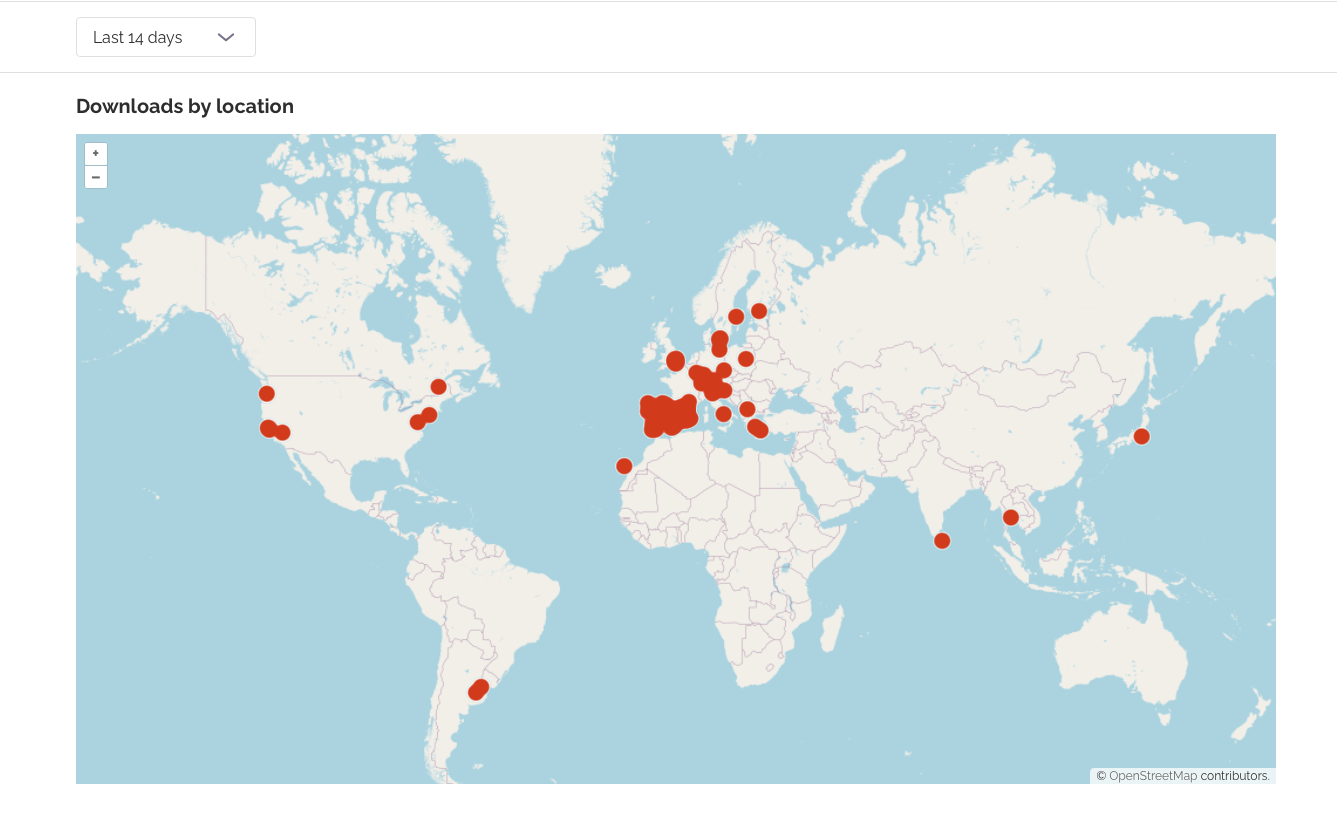 The heatmap allows you to see the geographic location of the places where your podcast is most popular. Red dots indicate a larger audience by geographic area.
Was this article helpful?
That’s Great!
Thank you for your feedback
Sorry! We couldn't be helpful
Thank you for your feedback
Feedback sent
We appreciate your effort and will try to fix the article