RSS.com provides industry-leading analytics to podcasters. Our analytics services follow state-of-the-art guidelines in the industry to measure podcast metrics.
Our analytics service is based on the data we collect each time we receive a download request for your show. Because we are the hosting platform, when a listener downloads one of your episodes via Spotify, Apple Podcasts, YouTube Music, Amazon Music etc... they leave a footprint in our system through a, so called, “log”.
From this listener data we build your Analytics page. It has three tabs. Overview and Episodes are on every plan, and Reviews comes with Plus:
- Overview (this page) - a comprehensive snapshot of your entire show.
- Episodes - detailed data at the episode level.
- Reviews - your latest Apple Podcasts reviews.
To compare two episodes side by side, click Compare Episodes in the Episodes tab. See Comparison.

1. Overview Tab
The Overview tab provides a comprehensive snapshot of your entire show, compiling all your data into one easy-to-read dashboard. This feature allows you to see the big picture at a glance, making it simpler to track your show's performance and identify trends.
Here’s the data that includes:
- 1.1. Downloads: Last 24 hours, Last 30 days, and All time.
- 1.2. Rolling Average Subscribers (RAS).
- 1.3. Downloads timeline.
- 1.4. Listeners.
- 1.5. Apps, podcast directories, and browsers.
- 1.6. Top 5 cities and downloads by country.
- 1.7. Downloads by location.
- 1.8. Downloads time and week day.
- 1.9 Downloads by devices and platforms.
- 1.10. Web Downloads.
- 1.11. Top Web Referrers.
- 1.12. Data quality.
Let’s break down and understand each section, one by one.
1.1. Downloads: "Last 24 hours", "Last 30 Days", and "All time"
In our metrics the term "download" counts each time at least 60 seconds of an episode reaches a listener, once per episode per listener per day (00:00 to 23:59 UTC), with bots and duplicates filtered out. It doesn't matter if a listener saves an episode on their device or streams an episode from an app. Each would count as a "download". Download counts are updated every hour (see How often are my analytics updated?).
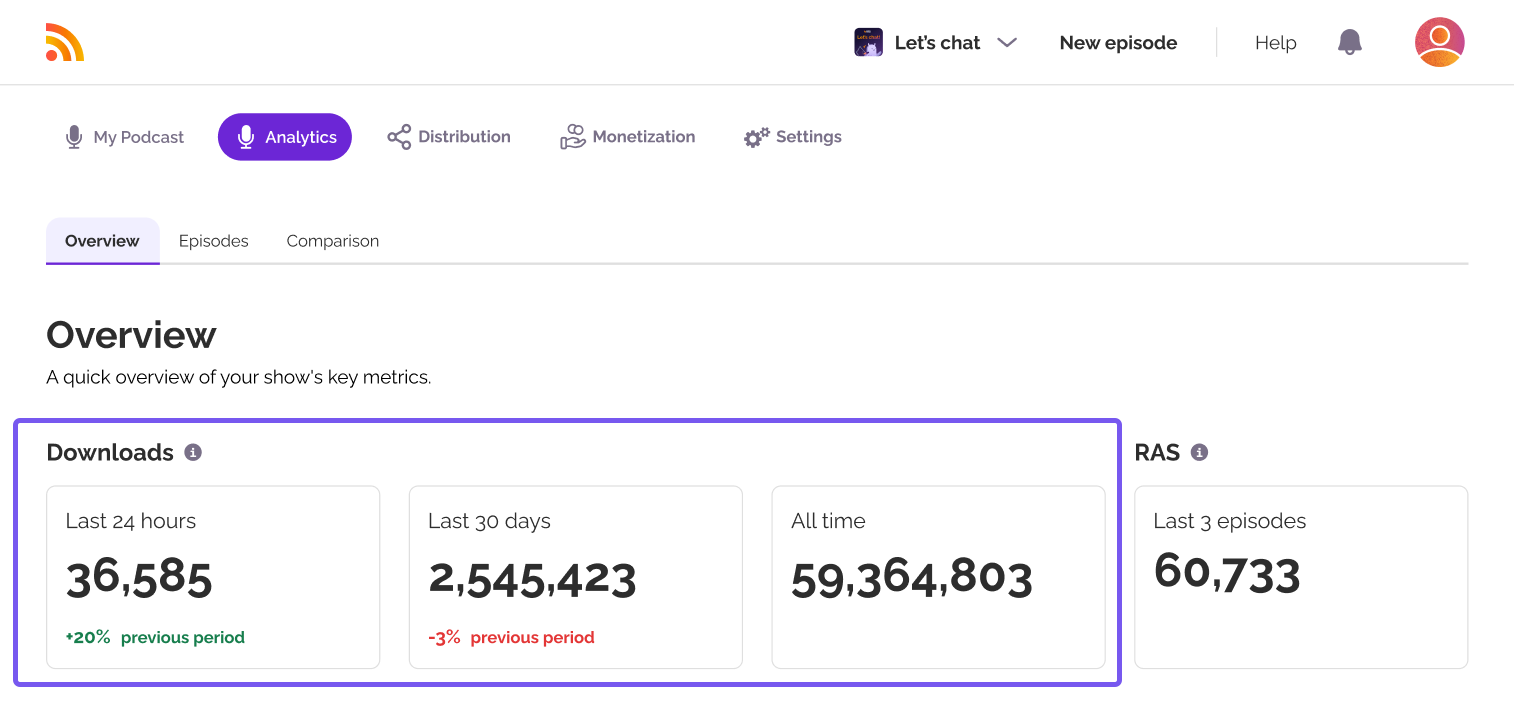
Important: Deleting an episode does not affect the total show downloads. The data includes any episodes that have been removed.
1.2. RAS (Rolling Average Subscribers)
While RSS.com does provide industry-leading analytics to podcasters, it is not currently possible to accurately determine how many followers/subscribers a show has. This is because most podcast players, apps, and directories either do not track followers/subscribers or they don't report those numbers.
However, you can estimate the number of followers/subscribers for your show! RSS.com provides a first-of-its-kind metric called "RAS" or "Rolling Average Subscribers" which counts the number of individual listener devices downloading or streaming your show. "RAS" is the downloads average of your last 3 episodes 24 hours after their corresponding release.
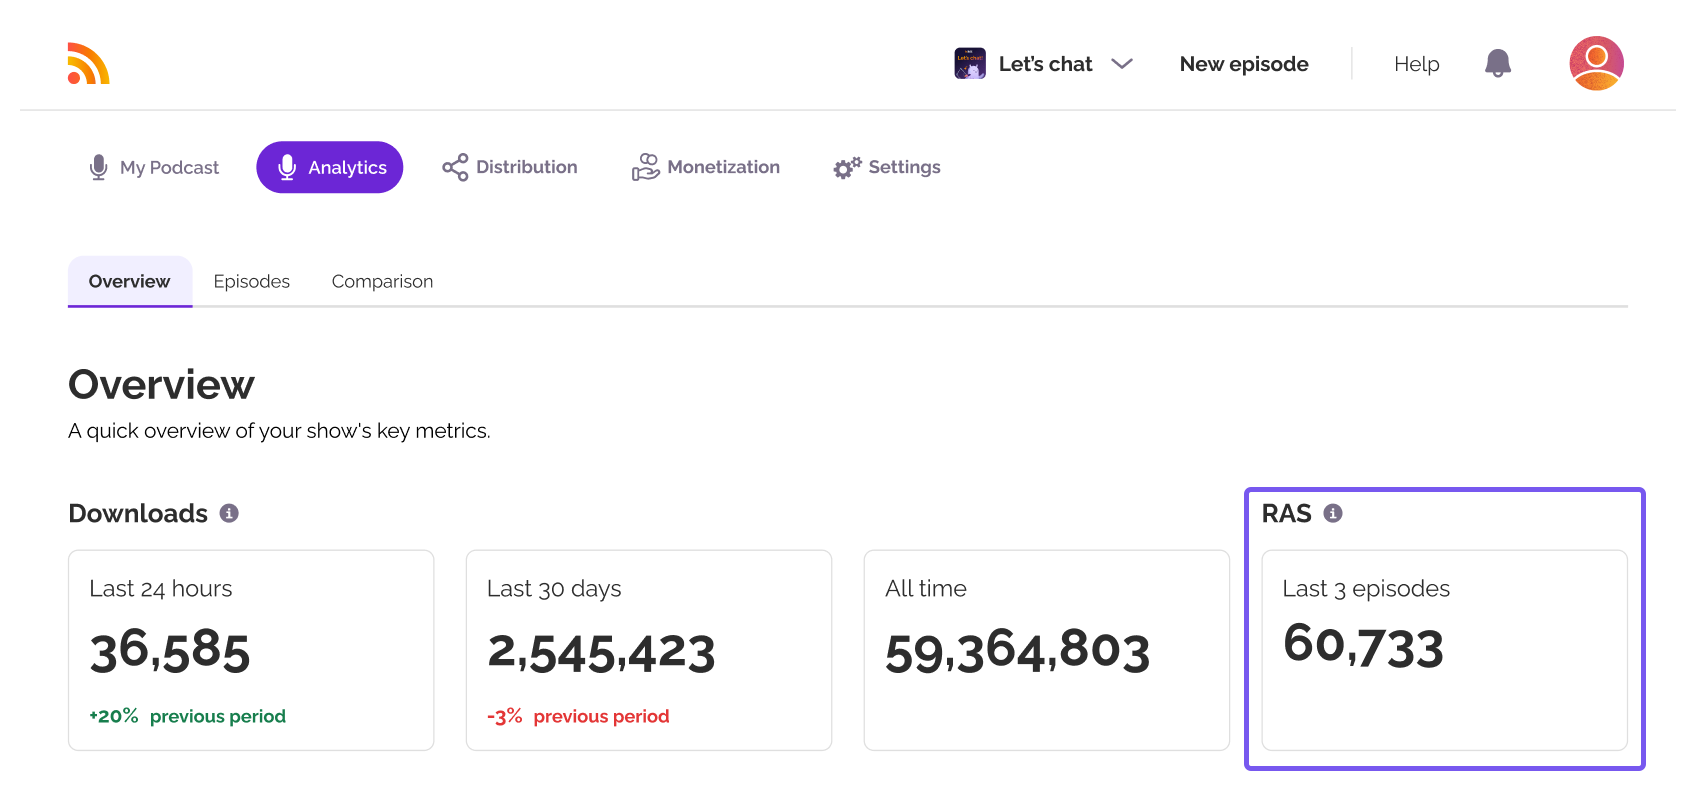
If your show is released every Friday at 6:00 am and you get around 100 downloads every Friday morning week after week, then it's safe to assume that you have roughly 100 followers/subscribers (this number may include listeners who accessed the content in the first 24 hours through other means like social media, and aren't an actual "follower/subscriber" of your show).
1.3. Downloads timeline
Use this graph to track your progress and identify trends with your Downloads. Keep in mind that total downloads (shown next to the title label) is also updated when the dropdown menu picker changes.
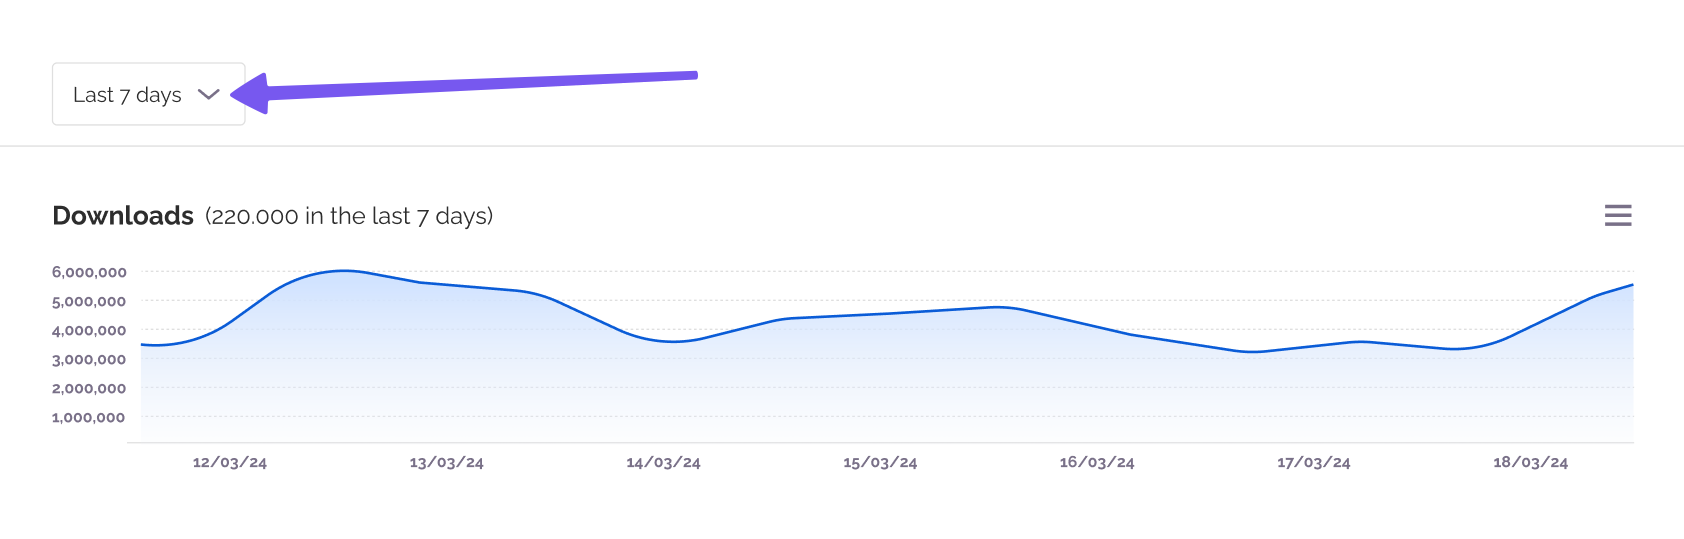
Important: The date range for all the data displayed below, not just "Downloads timeline", but all the metrics down the fold, can be adjusted using the dropdown menu to the last 7, 14, 30, 90, 180 or 365 days, all time, or a custom date range. Free shows up to the last 30 days, Plus up to 180 days, and Pro and Max add 365 days, all time and custom ranges.
1.4. Listeners
A listener is an individual who listened to one or more episodes of your podcast. The chart uses the same date range as the one above it.
Each point counts a listener once, so daily figures do not add up to the total for a longer range. The count is an estimate built from the app and the network a request came from, not from a sign-in: the same app on the same network is one listener, and one person listening on a phone and a laptop is two. Bots are excluded, as they are from your downloads.
1.5. Apps, podcast directories, and browsers
This chart shows the distribution of downloads across apps, podcast directories, and browsers, giving you insight into where your audience is accessing your content.
Understanding the platforms your audience uses to access your content is crucial for optimizing your distribution strategy. With data on downloads by apps, podcast directories, and browsers, RSS.com Analytics provides a detailed view of where your listeners are coming from, allowing you to focus your efforts on the most popular platforms.

In the example above, most downloads come from Spotify and Google Chrome.
1.6. Top 5 Cities and Downloads by Country.
On Free, the table shows your top city and the country chart is blurred. Plus, Pro and Max show both in full.
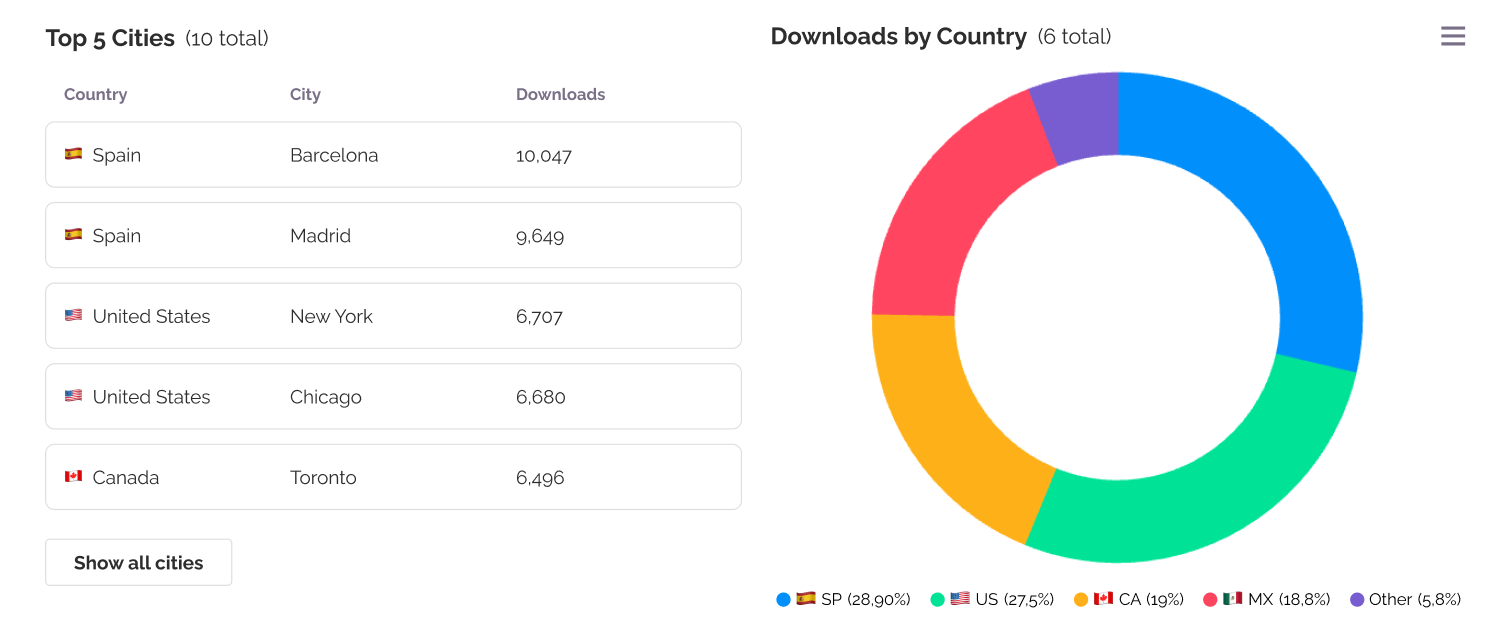
When analyzing your podcast’s performance, understanding where your audience is located can provide valuable insights. In RSS.com Analytics, you’ll find both city-level and country-level data to help you get a clearer picture of your listener distribution.
At the left, these are the top 5 locations - at the city level - with the highest number of downloads. Click "Show all cities" to see the full list of locations sorted by number of downloads. At the right, there’s the distribution of downloads by country.
1.7. Downloads by location
The map shows in full on Plus, Pro and Max. On Free it is blurred.
An interactive world map of locations with the highest downloads. Knowing where your listeners are tuning in from can greatly enhance your content strategy. With the Downloads by Location feature in RSS.com Analytics, you can see a detailed geographic breakdown of your audience, helping you tailor your episodes to better engage listeners from specific regions.
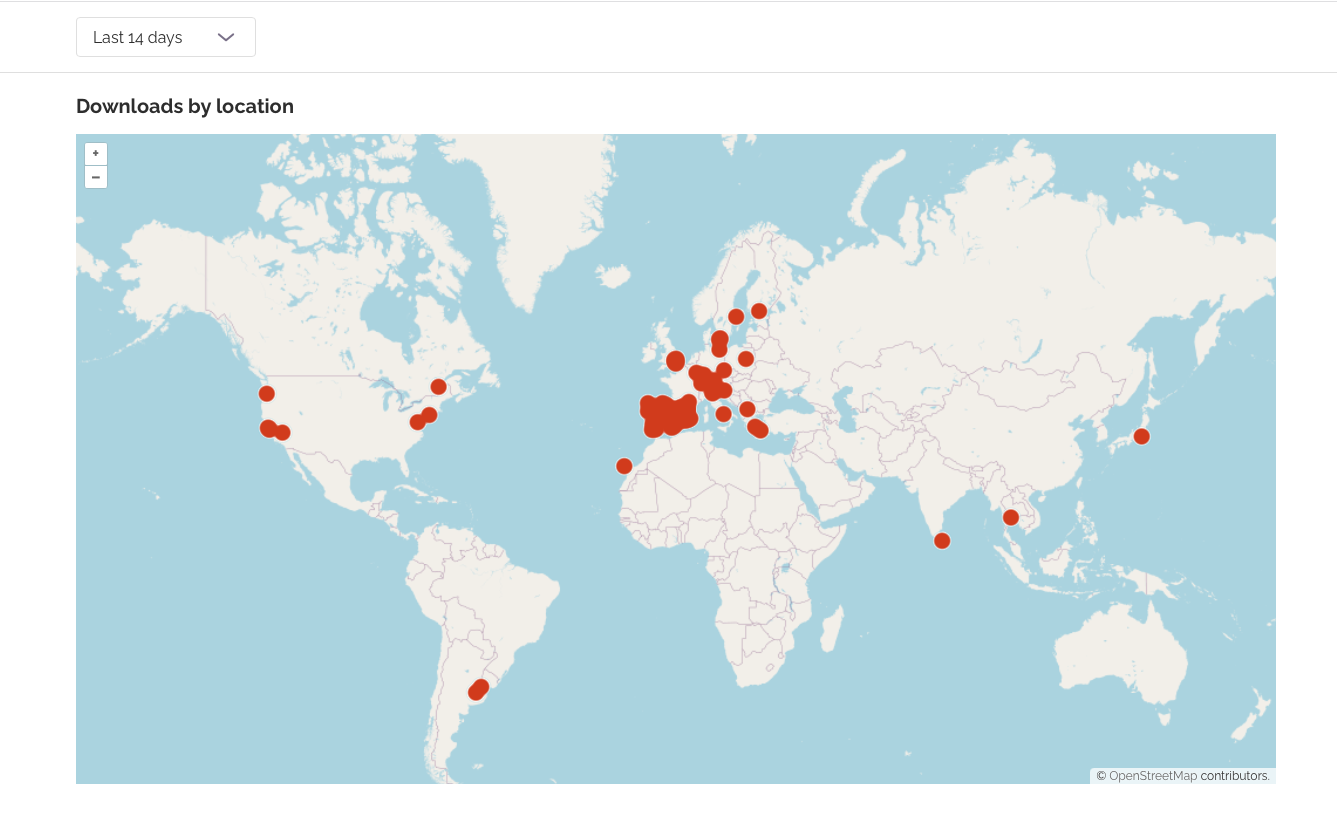 The heatmap allows you to see the geographic location of the places where your podcast is most popular. Red dots indicate a larger audience by geographic area.
1.8. Downloads time and week day
The heatmap shows in full on Plus, Pro and Max. On Free it is blurred.
Timing your releases can significantly impact your podcast's reach and engagement. This heatmap helps you identify peak download times. Use this insight to schedule your episodes for maximum impact.
The below chart shows unique downloads of your podcast by day and time. The darker the color, the higher the number of downloads. Hover over any blue time slot to see the number of downloads. You can use this information to schedule the optimal publishing time for your new episodes and maximize downloads.
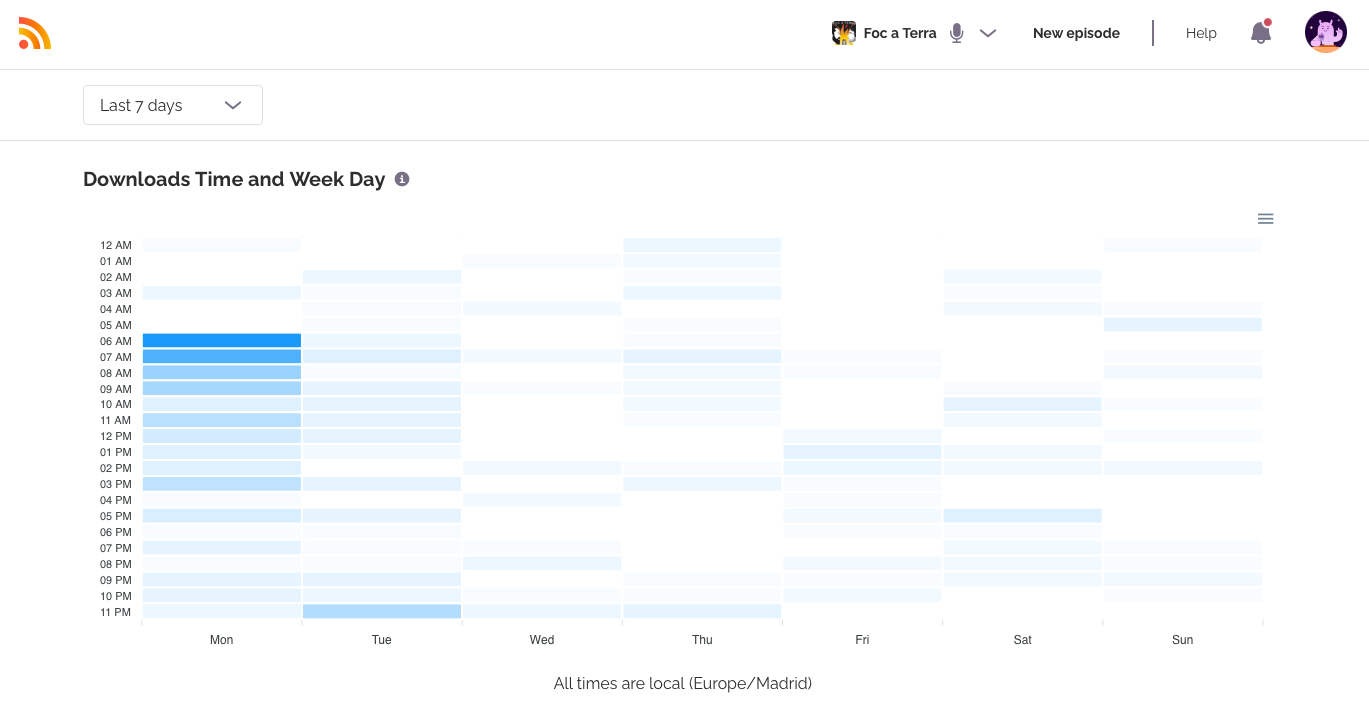
All times are local.
1.9 Downloads by devices and platforms
Knowing which devices and platforms your audience uses can help you optimize your content for a better listener experience. This section provides insights into the types of devices and operating systems your audience prefers, enabling you to tailor your podcast for the best performance across different technologies.
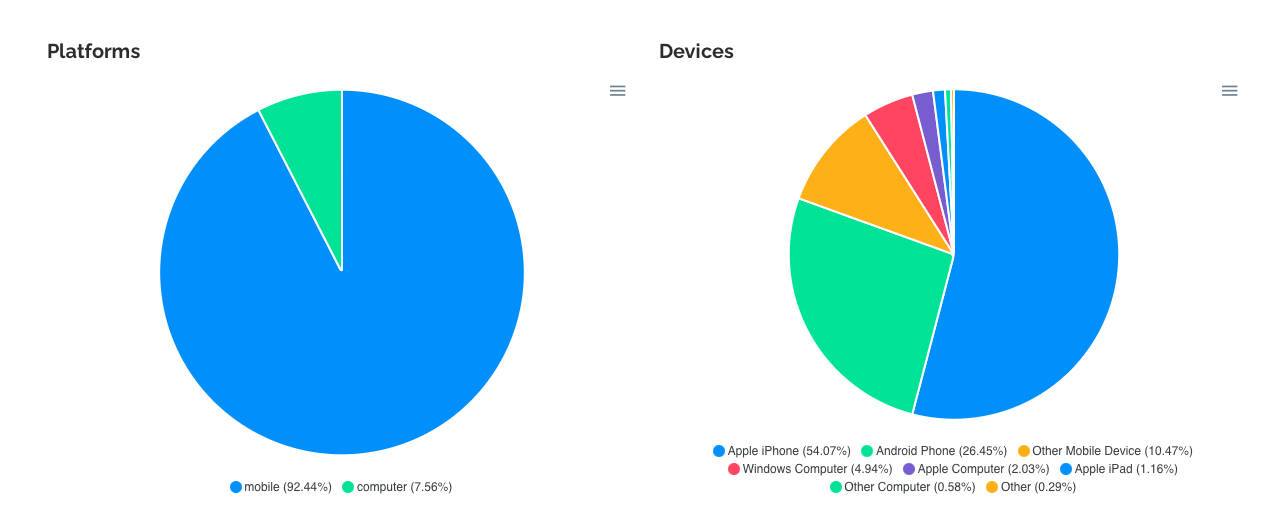
These pie charts map the devices and platforms where the podcast has been downloaded (by percentage). Hover over each slice to see the percentage of downloads for each source.
1.10. Web Downloads
Most listening happens in an app, so this chart covers the rest: the share of your downloads that came from a browser. That includes the player on your RSS.com podcast site, players you have embedded on your own website, and links opened from social posts.
1.11. Top Web Referrers
On Free you see your top referrer. Plus, Pro and Max show the full list.
This lists the websites sending listeners to your web-played episodes, so you can see which channels are driving downloads. Not every site passes referrer information, so it is a partial view rather than a complete one. Read more about Web Downloads and Top Web Referrers.
1.12. Data quality
Accurate data is essential for meaningful insights. The data quality filter automatically excludes bots and crawlers, so your download metrics follow the IAB measurement standard. This helps you make more informed decisions based on clean, reliable data.
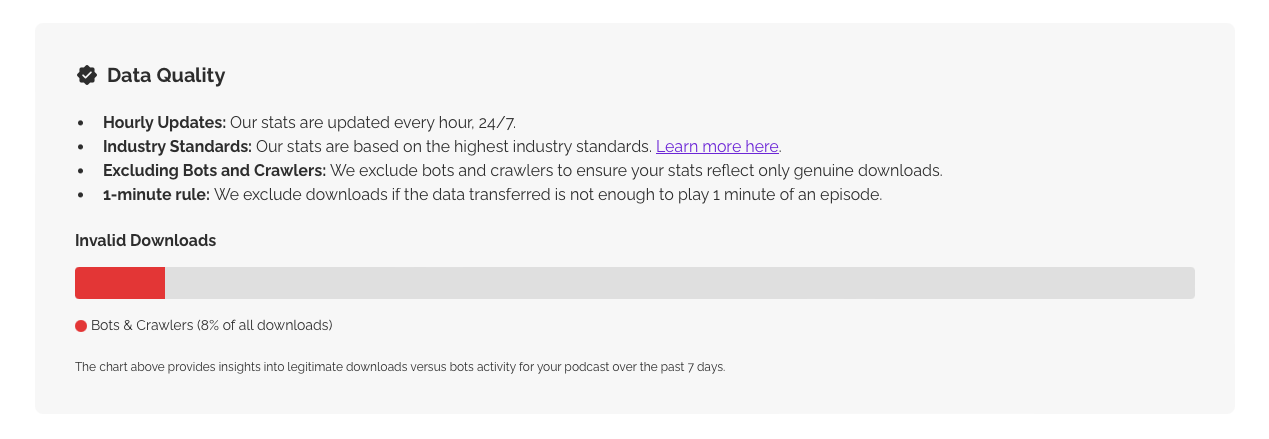
Important: Known bots and crawlers are filtered out of your stats, in line with the IAB measurement standard. No filter catches everything, so a sudden spike you cannot explain is worth checking before you read it as growth.
Was this article helpful?
That’s Great!
Thank you for your feedback
Sorry! We couldn't be helpful
Thank you for your feedback
Feedback sent
We appreciate your effort and will try to fix the article